Tag: gdp

Recession and Recovery: How Long?

I’ve commented earlier that many economic forecasts seem to assume reversion to the mean – here, meaning average economic growth over the last two decades. For a great example, go to the Wall Street Journal and admire the GDP growth rates projected for Q3 2009 through Q2 2010, marching happily up and to the right. (The numbers are 0.6%, 1.8%, 2.3%, and 2.8%.) This recession is different, however, and even if there is a mean to revert to after U.S. households decide how much they want to save, there’s no telling how long it will take.

For one perspective, the Carnegie Endowment for International Peace had a session at the end of April featuring a few IMF economists. Marco Terrones (link to PowerPoint at the bottom of the page) looked at the typical duration of a recession and the ensuing recovery. The duration of recovery is measured to the point at which the economy reaches its previous peak output (the output level when the recession began – December 2007 in our case). He looked at 122 recessions since 1960. 
Continue reading “Recession and Recovery: How Long?”

GDP Growth Rates for Beginners

For a complete list of Beginners articles, see Financial Crisis for Beginners.

My post about French sociology got a wide range of comments, ranging from “Without a doubt, your best post yet” to “Reading this post made me think, for the first time, of ignoring Baseline Scenario from now on,” which I guess indicates we have a wide range of readers. In any case, for today I’m returning to something much more mundane: GDP growth rates. Like many Beginners articles, this one starts out with some basics, and then gets (a little) more interesting, but its main goal is to help you decipher the news that you already read.

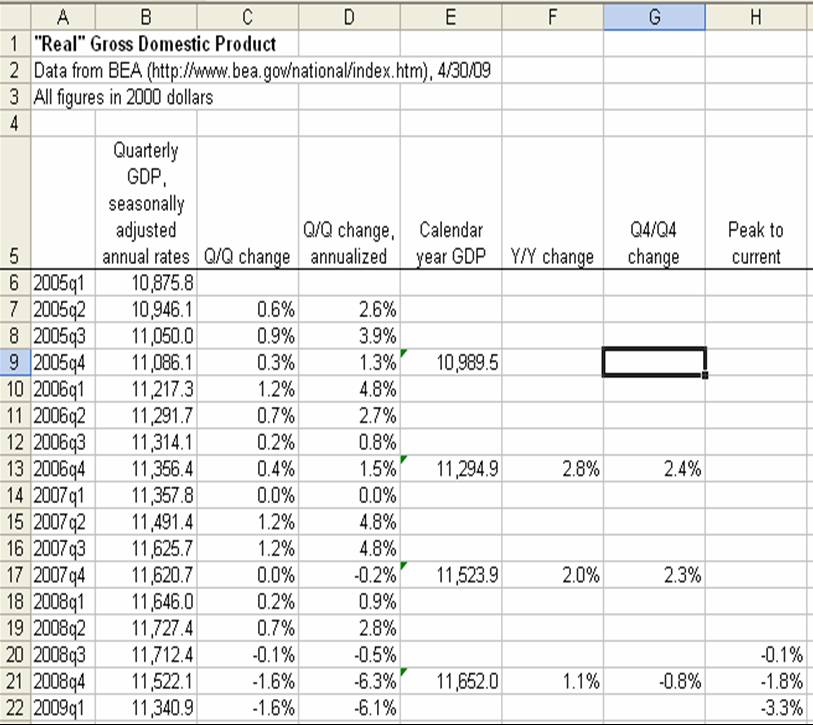
To a casual reader, yesterday’s GDP announcement was that Gross Domestic Product (an aggregate measure of economic activity) fell by 6.1% or, more precisely, at an annual rate of 6.1%. What does this mean?

For those of you who have never visited the BEA website, this is what the raw numbers look like. (They give you  columns B and E, I calculated the rest.) Note that this is all in 2000 dollars, so inflation has been taken out.

gdp1

Continue reading “GDP Growth Rates for Beginners”

Random Observations on the GDP Announcement

By now I imagine you know that GDP contracted at an annual rate of 3.8% in Q4, beating economists’ “consensus” prediction of a 5.4% decrease. (Why do people insist on calling an average of forecasts a “consensus?”) A few thoughts:

  • You can waste a lot of time looking over GDP statistics. Go to the news release page and download the Excel tables in the right-hand sidebar.
  • The “consensus” is that the reason for the positive surprise was an unexpected increase in inventories. (Goods added to inventory count as production, even if they aren’t bought off the shelves.) But . . .
  • With any set of numbers that add up to their totals, you can’t really find true causality. All you can do is point out numbers you think are particularly interesting. Another way to look at it is that the numbers were helped out a lot by short-term deflation, particularly due to falling gasoline prices. Personal consumption expenditures (PCE) , the biggest component of GDP by far, fell at an 8.9% annual rate in nominal terms. But the price deflator for PCE fell by so much – an annual rate of 5.5% – that in real terms PCE only fell at a 3.5% annual rate. That fall in prices was almost entirely due to the fall energy prices, which is highly unlikely to be repeated. But do people consciously reduce their spending in nominal or real terms? Nominal, I would think. So, as I “predicted” in December (I always have so many caveats that it’s not really fair to say that I ever predict anything), Q4 was better than expected, but Q1 is likely to be worse than predicted (before today, that is, since everyone is revising their Q1 forecasts down right now), since people will keep ratcheting down spending in nominal terms, but we won’t be bailed out by such a steep fall in prices.
  • The savings rate climbed from 1.2% to 2.9% – but it still has a long way to go (it was over 10% in the 1980s).
  • Real expenditures on food were down 4% (that’s not an annual rate, that means people spent 4% less on food in Q4 than in Q3). Ouch. I hope that was mainly a shift from restaurants to eating at home.

Back to more useful things.